
Update: You can now run an Audiense Insight report for a more detailed and advanced analysis on your followers or selected audience, including the audience segment breakdown. Follow the steps here.
View a Community Insights report to see detailed information and gain insights about any audience of interest.
View a Community Insights report
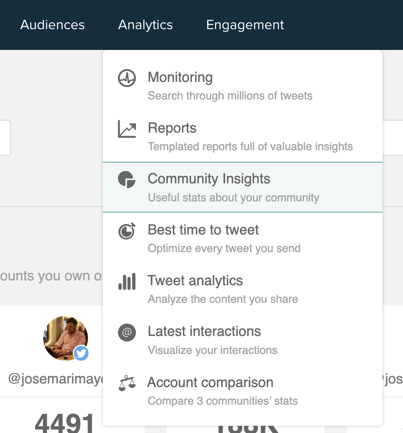
1. Select Community Insights from the analytics drop-down menu on the top menu bar.
2. The Community Insights reports screen opens. Each report you have previously generated is represented by a panel.
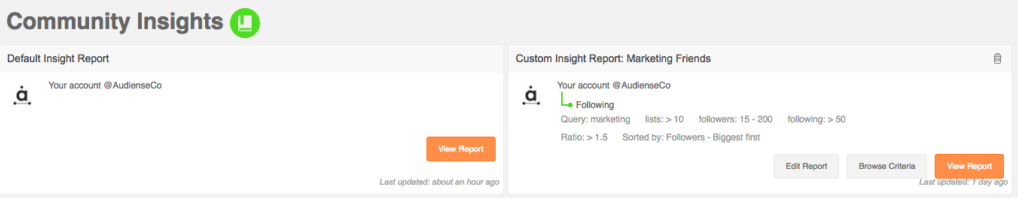
There are two types of report:
- Default insights report
- Custom insights report
The default Insights report for your community is in the top left of the screen. This report cannot be eliminated. You can export this report to PDF, Excel or Google Drive.
There is a panel for each custom Insight report you created for a specific audience. You can edit the panels that the custom report shows and browse the users on the community wall. Click the remove bin icon in the top right corner to eliminate any report which you no longer require. You can export a custom report to PDF.
Click view report on any panel to see the dashboard associated with that report.
Default Insights report dashboard
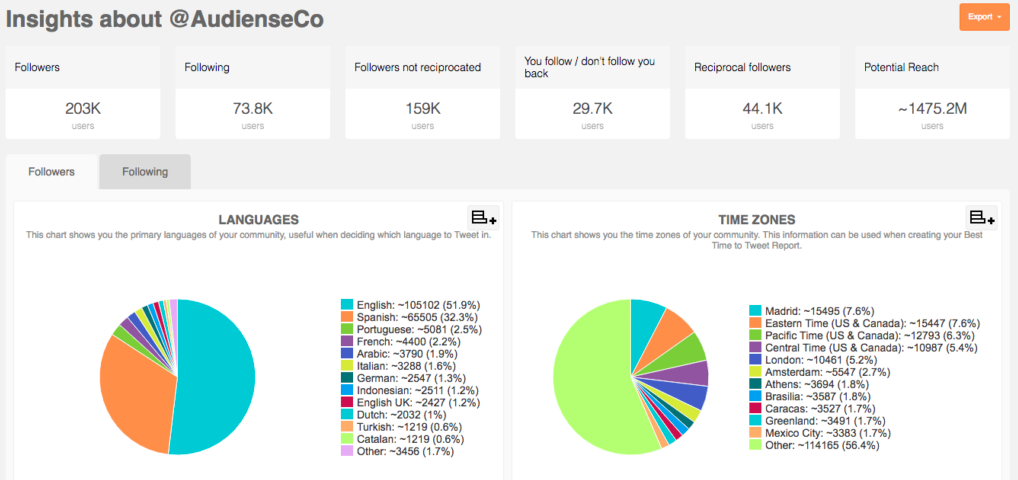
There are several summary panels:
- Followers
- Following
- Followers not reciprocated
- You follow / don’t follow you back
- Reciprocal followers
- Potential reach
Select the followers or following tab to see data specific to those users.
Panels on each tab can take the format of:
- Line graphs, e.g.
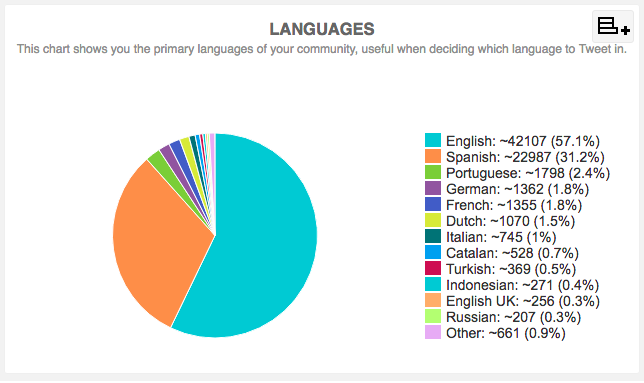
- Pie charts, e.g.
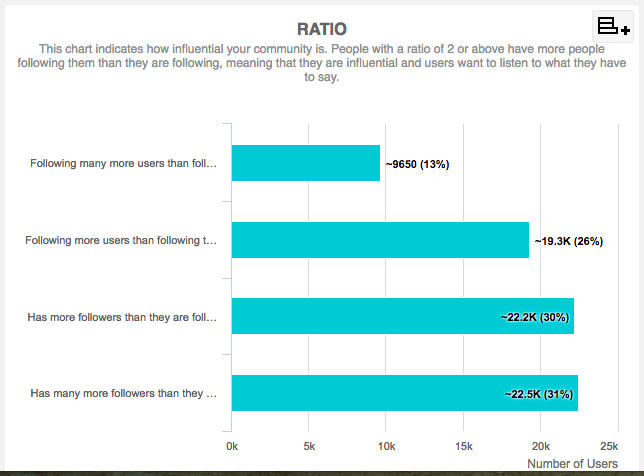
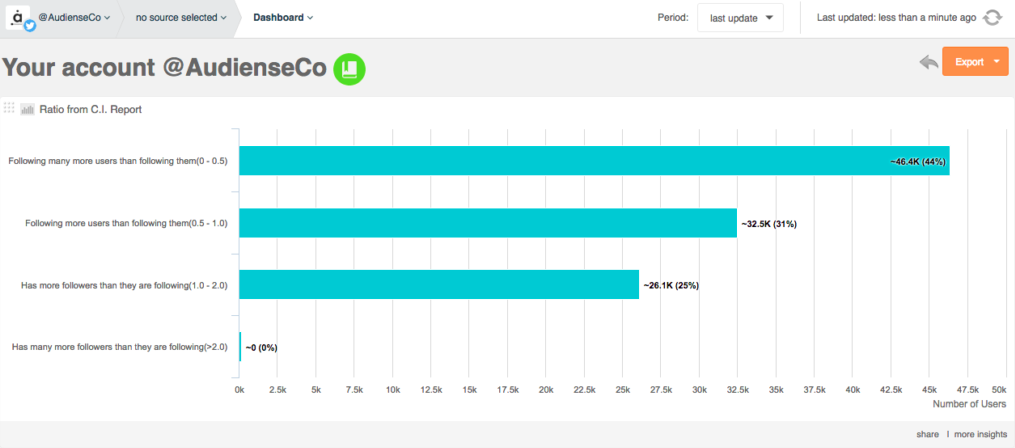
- Bar charts, e.g.
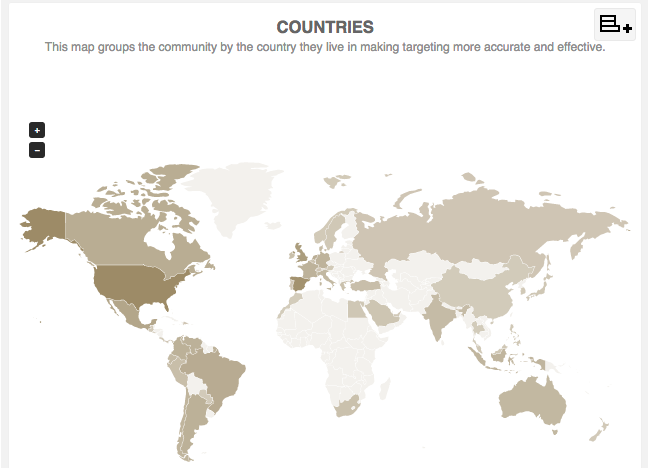
- Maps, e.g.
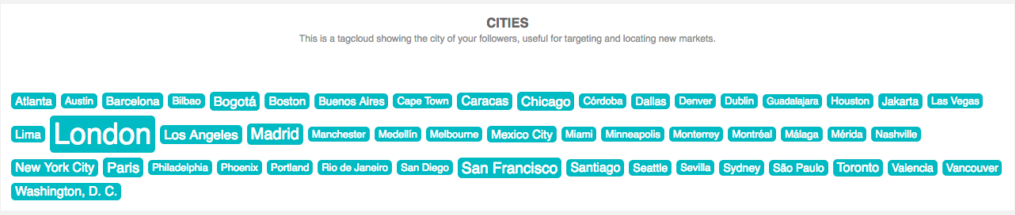
- Tag clouds, e.g.
The panels available on the default report, with the format in square brackets, are:
- Languages – May influence the language you Tweet in.
- Time zones – Useful for use in a BTTT report.
- Avatars
- Custom – Usually indicates a genuine user.
- Default – May indicate fake, inactive or a spammer profiles. Useful to help clean up your community.
- URLs – Does the user have a link in their bio?
- URL – Usually indicates a professional and links to a company, blog, etc.
- No URL – May indicate users of less interest to you.
- Privacy –
- Public – Ideally the more the better.
- Private – Unlikely to be a professional.
- Verified
- Non-verified
- Verified – Usually people of high influence, e.g. business leaders, politicians, journalists, musicians.
- Gender – As defined in the bio so may not be 100 percent reliable with ambiguous names. May influence your targeting strategy.
- Male
- Female
- Unknown – Companies, enterprises, etc., are not associated with a gender.
- Entity type – Helps separate company profiles from personal users.
- Individual
- Corporate
- Followers – Users grouped by the number of followers they have. Indicates your potential reach. The more followers your followers have, the more people will see your Tweets if they Retweet you.
- Number of people they are following – Users grouped by the number of people they are following. Users who follow many people are unlikely to read all your Tweets unless you are included in a list.
- Ratio – Users grouped by their ratio of followers/following. Indicates how influential the community is.
- Time since last Tweet – Users grouped by their activity level. Indicates how active the community is. Can influence who you unfollow.
- Tweets per day – Users grouped by the Tweets per day. Active users are more likely to Retweet, reply, etc. However, overly active users may be spammers or create too much noise and may influence your unfollows.
- Countries – Indicates where the community is located in terms of country. Useful for targeting and helps you discover potential markets. Based on bio information so not 100 percent reliable.
- Cities – Indicates where the community is located in terms of city. Useful for targeting and helps you discover potential markets.
- Bio – Indicates the interests of the community. Based on bio information.
The panels are interactive so click the area of interest to browse the users on the community wall and and carry out community management actions.
Click the [+] icon in the top right of the panel to add this panel to your dashboard.

Select the panel position on the dashboard (top, left, right) and optionally modify the panel title.
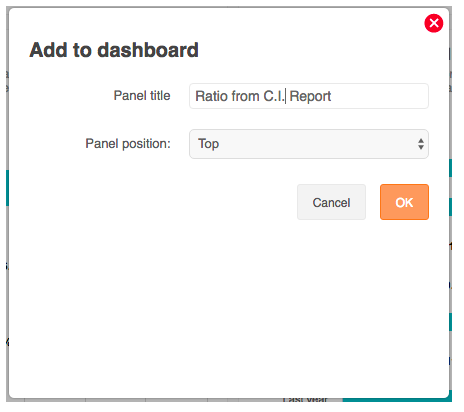
Click OK and you will be taken to the dashboard where you will see the panel in the selected position.
Custom Insights report dashboard
A custom Insight report is based on the panels you selected when creating the custom report.
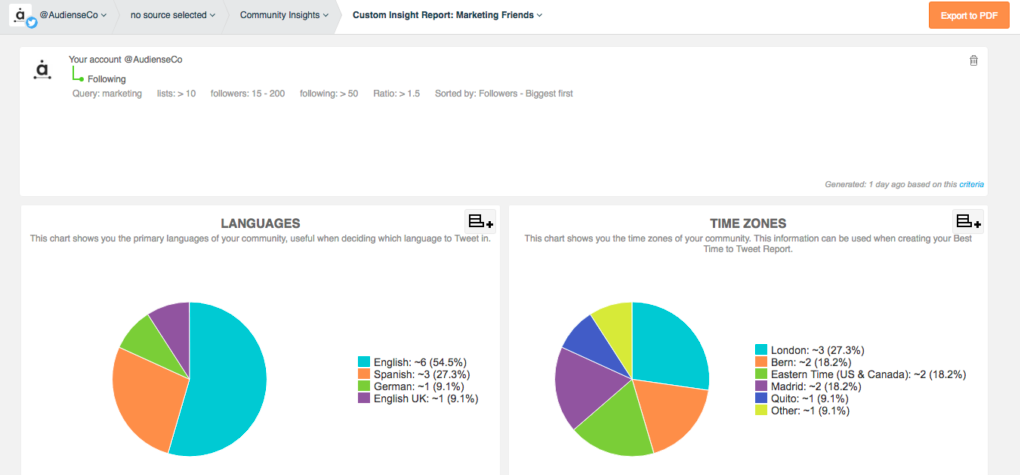
There is a summary panel which shows any search/filter and order by criteria used to create the audience of the report.
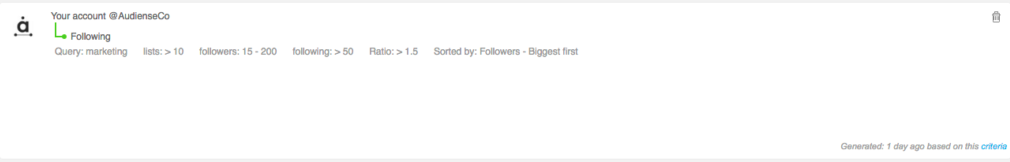
Click criteria in the bottom right of the summary panel to go to the community wall to browse the audience the report is based on.
Below the summary panel are the panels that you selected for that report.
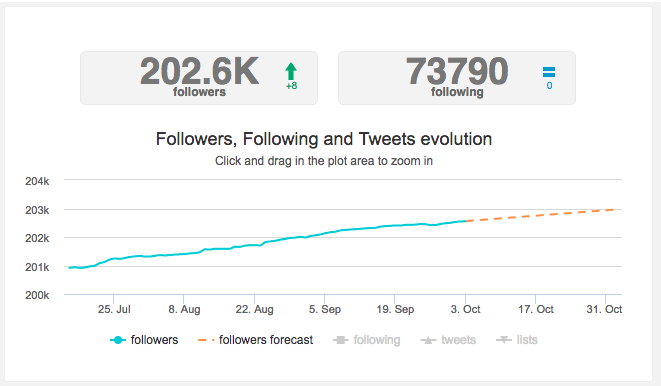
The panels available on a custom report are the same as those of the default report (above) with the addition, if selected, of:
- Evolution chart – The evolution over time in terms of followers, following, Tweets and lists.
Notes
All reports are updated automatically every 24 hours.
In order to optimise the performance of Audiense and give you a quicker response all Community Insights defaultmetrics of the dashboard are calculated based on a sample of users.
- If your audience has more than 17 000 members the calculation is based on a random sample of 17 000 and not the entire audience. The data is then extrapolated to 100%. This approach has a margin of error of less than 1% and doesn’t affect the validity of your results at all in practical terms.
- If your audience has less than 17 000 members we always use 100% of the audience to calculate all metrics.
However, if you do want to analyse the full audience then create a custom insights report of the audience by selecting this option from the all criteria drop-up menu on the community bottom bar.